 The Crested Butte News Serving the Gunnison Valley since 1999

“A steady parade of scientists”
[ By Kendra Walker ]
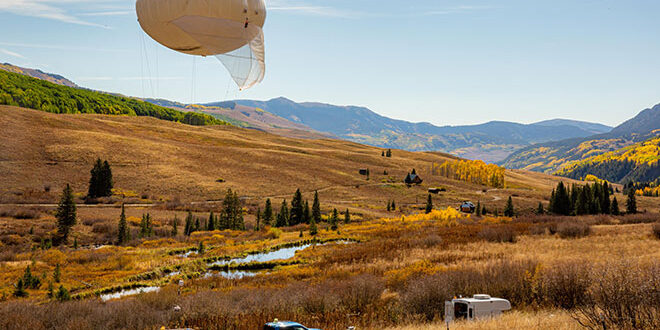
It’s been one year since the U.S. Department of Energy’s Atmospheric Radiation Measurement (ARM) facility made its home in Gothic, as part of a two-year study of the atmosphere in the East River Valley. The project, called Surface Atmospheric Integrated Laboratory (SAIL), is done in collaboration with the Lawrence Berkeley National Laboratory, Rocky Mountain Biological Laboratory (RMBL), Colorado State University, among others, and is collecting atmospheric data to help scientists better understand mountainous water cycles. The project began in September 2021 and will now extend through June 2023.
The ARM facility holds advanced scientific instruments measuring everything from precipitation, clouds, aerosols, winds, radiation, temperature, and humidity. Teams are studying how plants, soils, forests and bedrock take water from snowmelt and other precipitation and ultimately release it back into the atmosphere.
Over the course of the study, several hundred people are involved with approximately 48 different data streams at the facility, said SAIL principal investigator Daniel Feldman of Lawrence Berkeley National Laboratory.
Each instrument has its own mentor, a person responsible for making the data high quality for the science community, he said. And while each instrument is typically monitored remotely, sometimes the mentor will come to the site to make updates and adjustments. As Feldman puts it, a steady parade of scientists has come out to Gothic over the past year. “It’s a big group of folks involved and continues to grow. Everyone is really excited to learn about how these mountain systems are evolving the Upper Colorado River during this intense period of observations.”
Winter storms
Feldman shared some findings one year into the project, starting with last winter.
“We looked at several of these storm events that happened, for example the ‘Santa Slammer’ at the end of 2021,” he said, referring to the holiday storm of nearly 100 inches in 10 days. “That was so intense, and almost half of the snowfall for the entire season. That storm was really fascinating to look at what extreme snowfall means for this area and where is the extreme snowfall.”
Feldman noted that the total snowfall last winter was just about average compared to the last 30 years. “But we got there on a crazy roller coaster,” he said. “We had very little precipitation and then a whole bunch all at once, and a long pause, and then late winter storms. That was a great opportunity to understand these big snowstorms, what happens if the snowpack hangs around without fresh snow for a while and if that starts to compact and sublimate.”
Detailed measurements of where the snow fell were also compared to the area’s estimates of the snowfall. “That was really a bit of an eye opener,” said Feldman. “We saw that it had varied quite a bit from north to south, and the estimates that didn’t use our measurements were quite a bit off.”
For example, on Christmas Eve the weather forecast estimate showed close to 50 mm of precipitation near Gothic, but the SAIL measurements showed 35 mm. In Brush Creek, the weather forecast estimate was 28 mm and the SAIL measurements showed 55 mm.
“The numbers are all off for where snow is actually falling and how much without these SAIL measurements,” said Feldman. “That was a fun result to unpack and try to understand where the forecast can be improved and why it’s off there. It’s known the radars from Grand Junction aren’t able to reach Crested Butte because of a lot of mountains in-between, but at the same time we’re trying to fill these gaps without direct measurements.”
Feldman also noted lots of cold, dry and windy days. On those days, the snow will blow up, but not all of it comes back down to the surface. “We found in the first winter that there’s a lot of times that sublimation happens during the day, but at nighttime it’s the opposite of sublimation. We saw this cycle of water coming out of the snowpack into the atmosphere and then going back down at night. That’s really relevant to this community to understand whether or not there’s water in the atmosphere during the day and if it’s then creating a hoar frost, which has implications for how unstable snowpack becomes,” he said.
Windy spring
“The spring was really windy and really dusty,” said Feldman. “We were able to make measurements of the dust when it got onto the snow when major dust events came in and darkened snow right away. But sometimes the dust came along the way in winter and got exposed during melt out, and we were also able to measure when the dust emerged from the snow.”
Feldman noted that in general, the snow was a lot darker this spring than normal.
Rainy summer
Feldman documented the numerous thunderstorms that took place over the summer. “We had a very active North American monsoon and that brought a number of storms. I counted at least 38 days where we measured precipitation in the SAIL instruments. So we had a lot of different storms to test out.”
Feldman said they were able to measure details that make up the actual structure of these storms, including how tall, how big, where is it raining, are other forms of precipitation occurring like hail, how much.
And while Feldman noted the total amounts of summer precipitation are still being unpacked, he said the storms experienced here in Crested Butte had a very similar structure to those that form in the Great Plains. “They were very similar, with strong updrafts and the same general core structure. They go just as high as a thunderstorm in the Great Plains, but they start at 10,000 feet above sea level and cap out at the same place.”
Feldman said overall it was a banner year for the monsoon. “But at the same time it was not a super banner year for the actual amount of water going down to Blue Mesa Reservoir,” he said. “That’s going to be an area for not just SAIL, but for our partners at RMBL, the Upper Gunnison River Water Conservancy District, for interested parties around Crested Butte and throughout Gunnison County to be considering. That is a big deal and lots of different types of science and user perspectives are needed for that.”
Heading into year two
Currently there are three full-time technicians at the SAIL site. “They are really responsible for making SAIL run and are so central to the data collection for SAIL,” said Feldman. “Those 48 different data streams need a lot of tender loving care to actually happen.”
The technicians also launch weather balloons twice a day to monitor how the atmosphere will evolve over the course of the SAIL campaign. “That evaluation is really important for understanding when snow comes in and how much colder is it at the surface compared to rest of the atmosphere,” said Feldman.
Going into the second year, Feldman says SAIL will continue to bring in friends from the science community. This week, the National Center for Atmospheric Research is deploying a set of instruments that will target the way snow sublimates and evaporates. The National Oceanic and Atmospheric Administration (NOAA) is engaged in a study of precipitation called Study of Precipitation, the Lower Atmosphere and Surface for Hydrometeorology (SPLASH), which aims to improve the weather forecast in this area and other mountainous regions and the upper Colorado River. “It’s highly complementary to what we’re working on. They’re studying the science of how water really makes its way from atmosphere into streams, rivers and ground water,” said Feldman.
Additional partners are bringing new instruments this winter to measure snowflakes and capture what snowflakes look like. “We’ve got a camera that takes 200 pictures each second of snowflakes,” said Feldman. “It is true that every snowflake is unique, but they don’t always look like those pretty dendrites that you see in Frozen. Snow can look very different from that depending on the temperature and humidity it was formed at. How dense and heavy that snow is, and how much water is in them are all strong functions of the shapes of snowflakes.”
Ultimately, Feldman said, the focused efforts around the SAIL project are important for understanding what’s going on in the Crested Butte area but also the entire region of the upper Colorado River. “With this data, we have a deeper understanding of how these models actually work, and they start to become very useful and very powerful at making predictions of what storms will look like in the near term and how they will evolve longer term,” said Feldman. “It motivates us to think about all these little details — from snowflakes and what they look like, to the distribution of precipitation, what it looks like and how quickly it melts out, to what’s causing the monsoon season — and look deeper into what is causing those things.”
Feldman has enjoyed his visits to Crested Butte and Gothic. “It’s a fantastic place, I really enjoy the opportunities to explore and enjoy the landscape and get a direct feel for what the atmosphere is doing. It’s not just science but also enjoying the plentiful outdoors of the area, and it’s been great to experience it across the seasons.”
Feldman has also been impressed by the community’s interest and support for the project. “RMBL has been a fantastic partner here in making sure the community is aware of all the things happening and that students and members of the community have some information to learn about what is going on with SAIL and where it fits into the larger research activities. That’s been really great to see.”