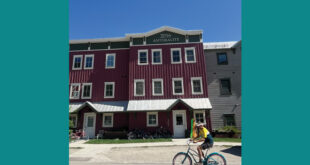
“Crested Butte is a weird place and that’s why we love it, right?”
by Alissa Johnson
So far, 2016 has been noteworthy for rising temperatures. According to NASA, first January and then February temperatures set significant records for being well above the global average for that month. But what about changing temperatures on a local level?
Joe Ramey, a general forecaster for the Grand Junction office of the National Weather Service, has analyzed temperature and precipitation records across western Colorado and eastern Utah. Using data from 11 study sites, including Crested Butte, Gunnison, Montrose, Grand Junction and Moab, Utah, he’s found a definite trend.
“Maximum temperatures haven’t changed a lot over the last 100 years. They’ve been up and down and somewhat inversely correlated to precipitation. Dry periods are typically hot and wet periods are cool, but minimum temperatures seem to show a marked increase, especially since the 1970s,” Ramey said.
He found that same trend analyzing nine sites in national parks and national monuments across the region. That comparison is important. Across the study sites there have been some gaps in data collection as well as variation in the locations and methods used for data collection. In Grand Junction, for example, data collection moved from downtown to the airport in 1946, or five and a half miles and 230 feet in elevation change.
While data collection in the national parks and monuments didn’t really begin until the 1960s, locations and methods have remained unchanged; many still use mercury thermometers. These sites also haven’t experienced urbanization, which can create local warming.
“One of my assumptions with this is that the 11 study sites can capture what’s happening for the region. One reason I looked at parks and monuments is that it’s a different data set in locations without urbanization going on to see how they compare, and they do compare nicely,” Ramey said.
Comparing the data sets for the study sites and the parks and monuments for the climate periods of 1981 through 2010 and 1961 through 1990, both data sets show similar trends. Maximum temperatures rose .4 degrees Fahrenheit and minimum temperatures increased 1.1 degrees Fahrenheit for both sets of sites.
“The exact same rate of change seen in these two data sets indicates that any site change problems with the study sites are not significant, at least at this resolution,” Ramey wrote in his report, “How has the Climatological Average Changed over the Last 100 Years in Eastern Utah and Western Colorado?”
He explained to the Crested Butte News that the standard in weather forecasting is to look at the 30-year average—when a forecaster says that it is colder than normal or warmer than normal, he or she is comparing the forecast to the latest 30-year average. That average is updated every 10 years and will be recalculated in 2021.
Curiosity led Ramey to look at how those 30-year averages compared. “My initial thought was in 2011, how does our new average of 1981 to 2010 compare to the old one of 1971 to 2000? And that started the whole ball of wax,” he said.
He went all the way back to 1911, which means that for each study site, including Crested Butte, someone since then has been recording a maximum and minimum temperature and precipitation every day.
Ramey’s analysis simply looks at the trends. It does point out causation, but he did note that his findings coincide with climate change projections from both the National Oceanic and Atmospheric Administration (NOAA) and the Intergovernmental Panel on Climate Change (IPCC).
According to the IPCC website, “Almost everywhere, daily minimum temperatures are projected to increase faster than daily maximum temperatures.”
And according to the NOAA, average temperatures across the United States between 1981 and 2010 were .5 degrees Fahrenheit warmer than the 1971 to 2000 time frame.
Ramey pointed out, however, that not every study site shows the exact same trend and Crested Butte is among those that vary. “Crested Butte is a weird place and that’s why we love it, right? At many different levels. There is a warming trend since the 1970s in Crested Butte, but I can tell you that back in the ‘50s and ‘60s it was warmer than it is today. That was also a relatively wet period,” Ramey said.
“I don’t know why it was so warm in the ‘50s and ‘60s and then cooled down markedly into the ‘70s but again, it hasn’t reached the level of the ‘50s and ‘60s and the maximum temperatures are kind of whacky, too,” Ramey continued.
That kind of fluctuation at an individual study site didn’t seem too surprising to Ramey. He attributed it to the variability of weather in the region, where one summer of really heavy thunderstorms can skew the data at a particular location.
“We have quite random weather in our forecast area, so to pull out trends they may not show up at one site,” he said.
You can view the study, updated to reflect 2011 through 2015, at http://www.weather.gov/gjt/ClimateTrends.
 The Crested Butte News Serving the Gunnison Valley since 1999


